Commentary
Riverside and San Bernardino Counties in Southern California have 52 cities. A number of their residents work in Orange County and make their commute using the Riverside Freeway, its express lanes, or the Metrolink rail.
As housing costs tend to be higher the closer one comes to the coast, moving to the Inland Empire (IE) provides for more affordable housing. For years, this phenomenon has been described as “driving until you qualify.”
But the Inland Empire has enough job opportunities within its borders to employ most of its residents, explaining its robust growth.
Obtaining current financial data for California’s cities is not easy. Most cities have excellent website modules for providing their annual budgets and audited financial statements. However, some, like the city of Westmorland in nearby Imperial County, are an embarrassment when it comes to being transparent.
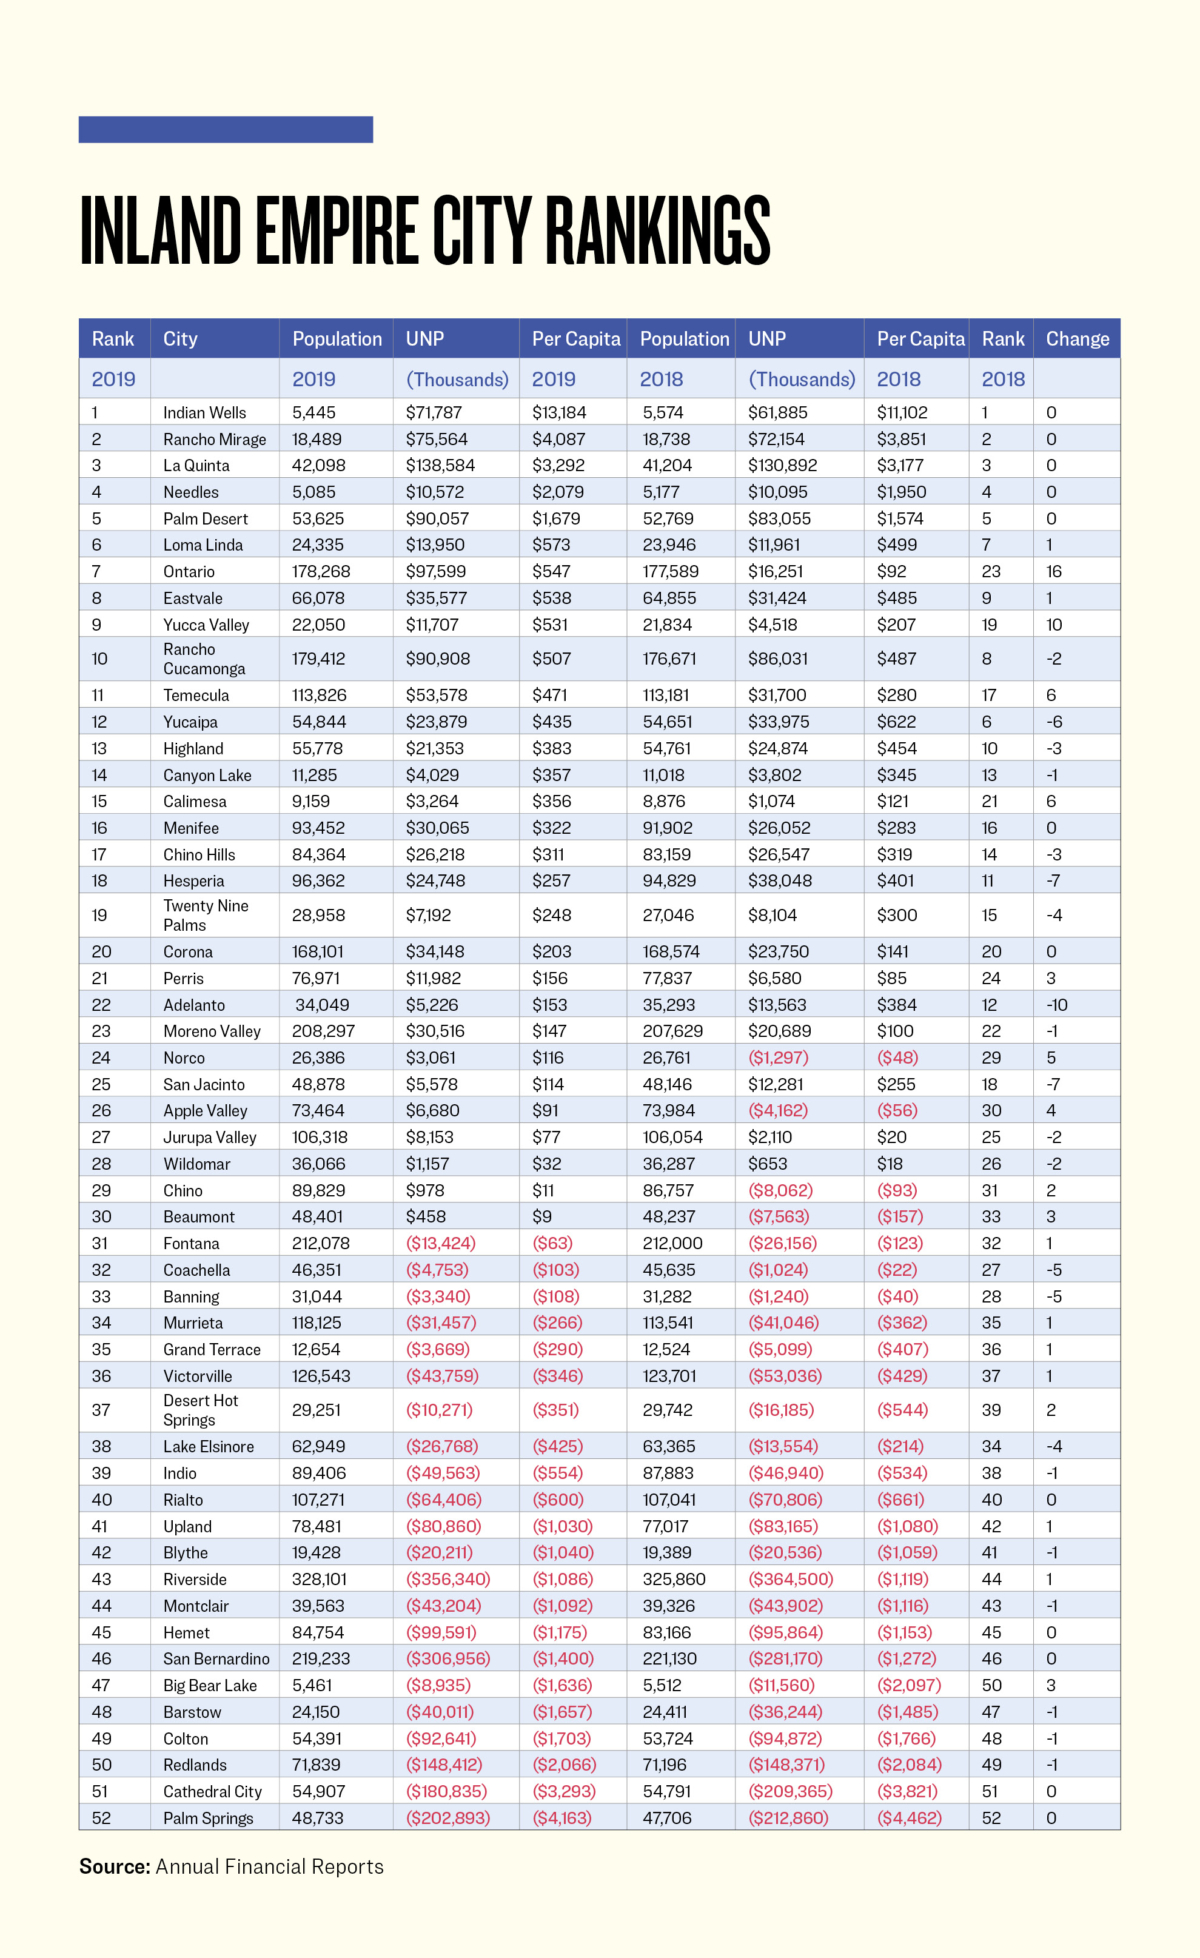
Let’s take our first detailed look at the IE by comparing the years 2018 and 2019. The pre-COVID-19 Newsom lockdown numbers are found in their Annual Comprehensive Financial Reports (ACFRs). Using the unrestricted net position (UNP) for governmental activities on the statement of net position, divided by the cities’ populations, we obtain a per capita that can be used to provide a ranking of each city based on its financial status.
While most of the cities have been relatively stable, let’s look at those that moved six or more places.
As can be seen from the graph below, the city of Ontario jumped 16 places by moving some $43 million in Other Post-Employment Benefits (OPEB) liabilities to the business-type activities of its balance sheet (statement of net position). This city has had a rather volatile UNP over the years, as can be seen from the schedule on page 167 of its Annual Comprehensive Financial Report. Based on previous years, it seems that it is reverting to the mean in 2019.
The city of Yucca Valley reduced its restricted assets by $5.6 million, explaining the bulk of the $7.2 million increase in its UNP. This helped it move up 10 places.
The city of Temecula enjoyed an average of $62 million per year in property, sales, and other taxes for the previous nine years. For 2019, it received $96 million, helping to increase its UNP by $22 million and moving it up 6 places. Wine Enthusiast Magazine and others have recognized Temecula Valley as one of California’s serious wine destinations. Tourism has certainly been growing, with its wineries and ballooning opportunities. A toast for Temecula for the improvement to its balance sheet in 2019.
It is good to celebrate a tourist destination city that is managed well. As you can see from the graph, the city of Palm Springs is failing miserably. Orange County’s tourist destination, Anaheim, is not faring well either (see “Anaheim’s leaders cannot afford to ignore their city’s fiscal problems,” July 31, 2022).
The city of Calimesa had a similar story, with revenues exceeding expenditures by $6.1 million, which tripled its UNP from $1.1 million to $3.3 million, moving it up six places.
Looking at cities that dropped significantly, let’s start with Adelanto, as it has had a rough go for nearly three decades. In 1995, it narrowly avoided a very expensive legal battle with the Mojave Water Agency in a long-standing water-rights dispute. Having to pay San Bernardino County $5 million in December of 1995 as part of a redevelopment lawsuit settlement, it nearly defaulted on a $750,000 bond payment. It narrowly avoided filing for Chapter 9 bankruptcy protection or disincorporating. It has had plenty of recent drama with certain city councilmembers, and this city has been notoriously late on releasing its ACFR, with the 2021 and 2022 audits still not up on its website. Its UNP dropped by $8.3 million (61 percent), due to an increase in accounts payable of $5.8 million, dropping it 10 places.
The city of Hesperia’s drop of 7 places, with its UNP decreasing from $38.0 million to $24.7 million, was explained in its ACFR as follows: “This decrease is primarily related to a $15.0 million increase in loans payable to record the long-term portion of the loan with the San Bernardino County Transportation Authority (SBCTA) for the Ranchero Road/I-15 Interchange Project.”
The city of San Jacinto saw its noncurrent liabilities, including its pension obligations, increase by $6.7 million, explaining why the UNP dropped by the same amount. This caused it to drop 7 places.
Yucaipa saw a reduction in its program revenues from capital grants and contributions of $7.5 million, explaining the bulk of its $10 million decline in UNP, dropping it 6 places.
The top six and bottom twelve cities stayed pretty much in place. Of the 52 cities, 44 moved up or down 5 or less places, with 33 moving 2 places or less. The goal is to move up a place or two with each fiscal year, especially if the UNP is in negative territory, where 22 (42 percent) cities find themselves. It can be done, as Norco, Apple Valley, Chino, and Beaumont moved into positive territory during this fiscal year. Only 14 cities moved backwards, with Adelanto leading the pack by falling the most.
With the COVID-19 pandemic starting nine months into the next fiscal year ending, June 30, 2020, it will be interesting to see the impacts.
At least you have some beginning data with which to make intelligent inquiries of your elected city councilmembers. The big question is: What is the financial plan to get out of the hole, as 30 neighboring cities have been able to do?
Views expressed in this article are the opinions of the author and do not necessarily reflect the views of The Epoch Times.


