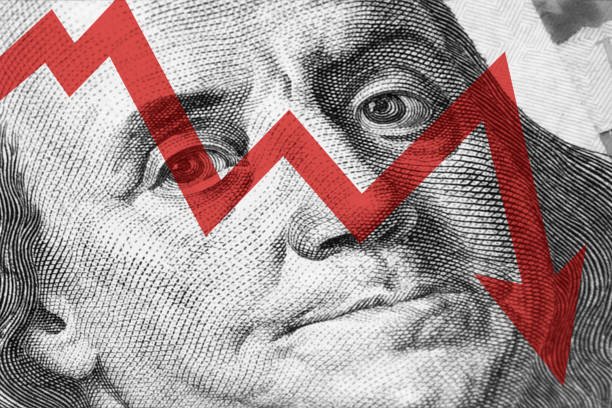
If our neighbors could allocate all their annual income to pay their debt, it would take just over three years to pay it off. During the 1960s and 1970s, that would have required no more than 1 1/2 years; however, there have been tremendous structural changes since 2008 and 2009.
Even if the U.S. were to grow at its official potential (an actual 2% per year), it would require up to four or more years to pay off its debt. It would take even longer without fundamental solutions to its indebtedness, which means, above all, freeing up other resources to invest and not depending increasingly on external financing, usually from China and Japan.
What does this trend mean for our country, which is so “enthusiastic” about industrial relocation? We must see it in perspective. There are challenges to the movement of investments.
Earlier, we reported that private debt in the U.S. currently contributes $65.7 billion — almost 68% — of the total debt in the country, and public debt, $32 billion — little more than 32%.
But let’s not fool ourselves: All debt is paid by taxpayers.
In the United States, almost a third of private debt is held by households. Yes, about 130 million households owe $19.7 billion, just over $150,000 per household.
Private non-financial companies, for their part, owe almost another third, with a total on the order of $20 billion.
And the portion of private debt held by private financial companies is close to $26 billion, which, when added to the indebtedness of households and non-financial companies, adds up precisely to the aforementioned private debt of $65.7 billion.
The debt of U.S. households (and nonprofit organizations) fundamentally has three components: 1) indebtedness for mortgage loans, currently on the order of $12.6 billion; 2) indebtedness for consumer loans, currently close to $4.8 billion; 3) and finally, other types of indebtedness, with a current amount of almost $2.3 billion. This adds up to that total household debt of $19.7 billion I mentioned earlier.
Thus, our neighbors’ households are directly responsible for 20% of the total [U.S.] debt. This constitutes an amount equivalent to 102% of their disposable net personal income, after deducting taxes and fiscal obligations, according to estimates by the Organisation for Economic Cooperation and Development.
(It must be said that current household mortgage loans represent 13% of total U.S. debt, a recovery following the explosion of its mortgage debt between 1998 and 2008, which raised it from 16% to 21% of the total debt.)
In addition, U.S. households are responsible for the taxes and fiscal obligations of the public debt that currently (let me repeat this) — account for a third of the total. And why? Because of a 15-percentage-point relief within the private debt.
Allow me to repeat: From 2008 onward, the private sector and state and local governments “reduced debt,” and the federal government became “indebted.” A classic castling of economic chess!
In 2008, private debt was 83% of the total. Public debt, only 17%. Today, private sector debt is 68% and the public sector debt is 32%.
Which private sector experienced the greatest debt relief? Households lost six percentage points; non-financial companies, five points; but financial companies lost 10 percentage points.
Crystal clear!
We will see more details soon. Really!
About this publication
Shop For Night Vision | See more…
Shop For Survival Gear | See more…
-
Sale!

Portable Mini Water Filter Straw Survival Water Purifier
Original price was: $29.99.$14.99Current price is: $14.99. Add to cart -
Sale!

Japanese 6 inch Double Edged Hand Pull Saw
Original price was: $19.99.$9.99Current price is: $9.99. Add to cart -
Sale!

Mesh Shooting Hunting Vest with Multi Pockets
Original price was: $59.99.$39.99Current price is: $39.99. Add to cart


